Usage of procurement procedures 2014-2024
I decided to update yesterday's table to include also the data for the open and restricted procedures started under Directive 2004/18/EC and 2014/24/EU:
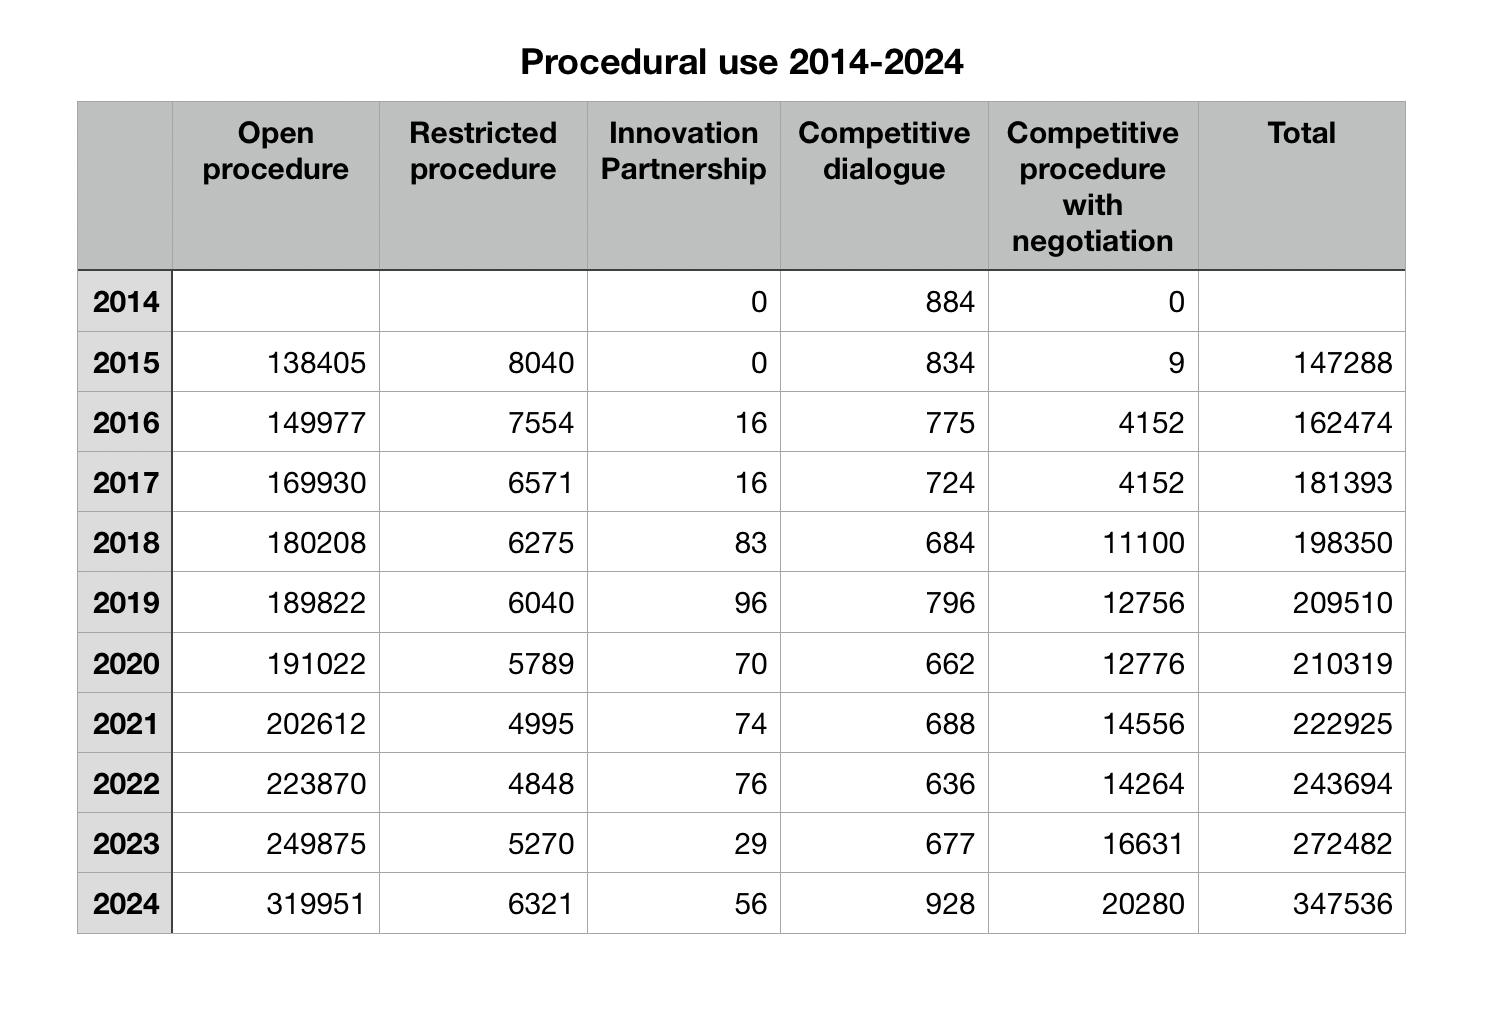
I could not find any data for 2014 on TED irrespective of what kind of search options I chose. The competitive dialogue figure is there because data for 2014 was available when I originally compiled the data a few years ago.
There are two interesting points here. First, the progressive increase in the total number of procurement opportunities being tendered. This is essentially due to the growth of the open procedure. Why is this happening? Smaller contracts above thresholds? Growth in total number of tenders even if procurement GDP percentage has remained stable? More fear of enforcement? Inflation dragging more contracts above thresholds? Even with the UK leaving, numbers go up.
The second interesting tidbit is the progressive irrelevance of the restricted procedure, both in absolute and also relative terms. I was not expecting this and need to think about it.
So we have ever more tenders launched and less competition in the number of bids per tender. Beyond the usual explanations of barriers, bureaucracy or corruption should we ask if the market is saturated? Where do we go from here?